Vulnerability Management System
Web Portal for Private Cloud
About
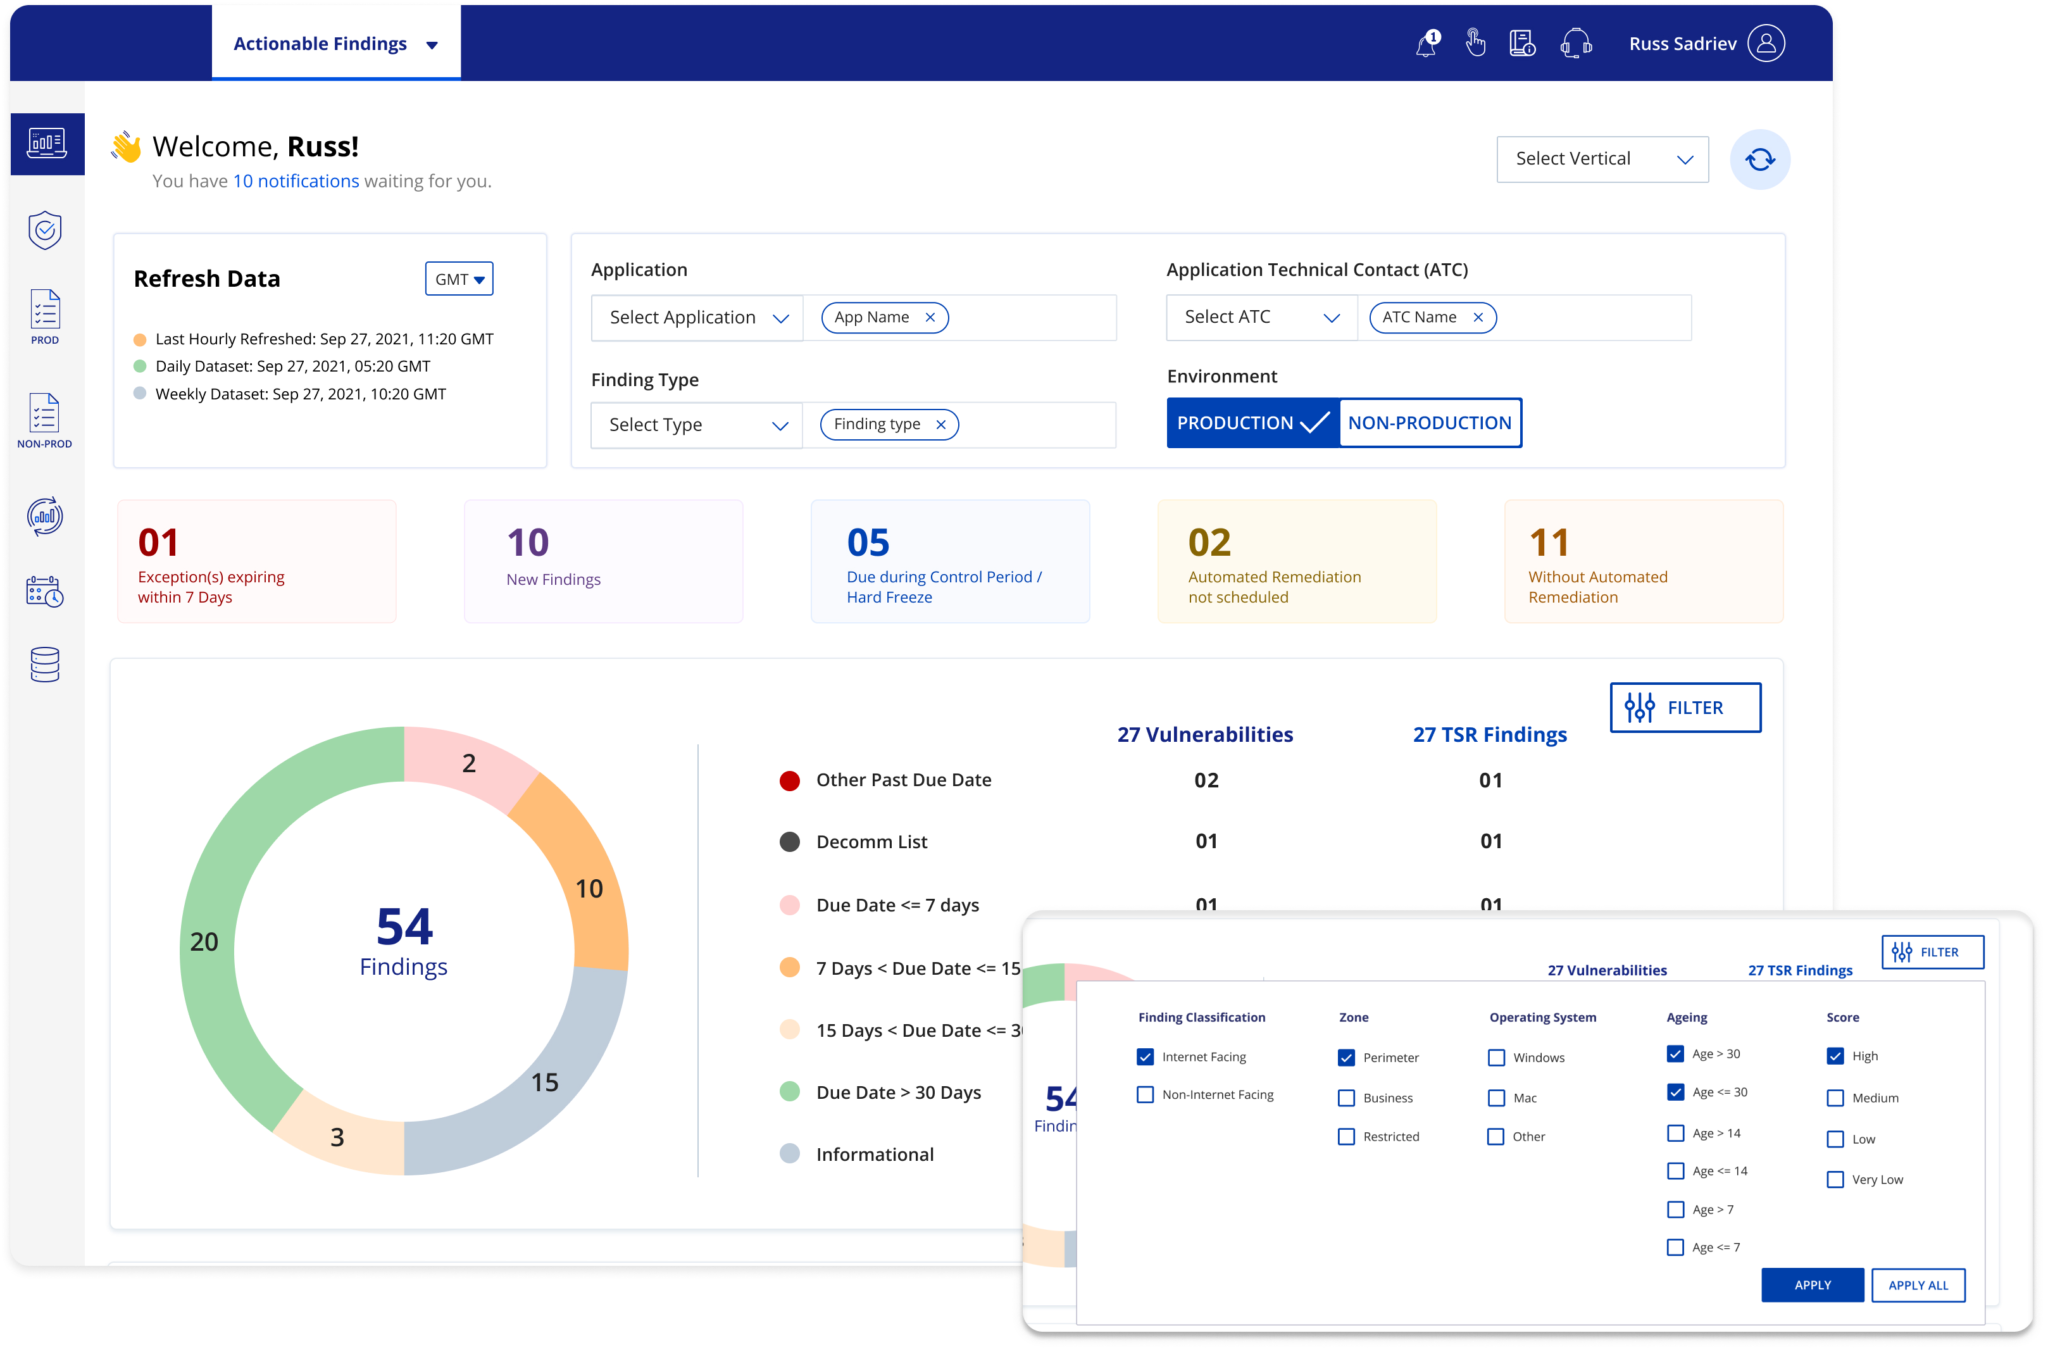
Vulnerability Management System is an enterprise application that scans software, workstations, detects critical vulnerabilities & provides secure remediations.
Overview
Improving how vulnerability management system tracks and remediates vulnerabilities faster to mitigate any risk and ensure operational efficiency.
Responsibilities
Research (Qualitative & Quantitative), Wireframe, Design (low-fi & hi-fi), Prototype.
The Problem
The existing version of vulnerability management application had major issues with –
• Creation, filtering and customisation of vulnerability reports.
• Vulnerability notifications.
• Creating, and sending list of suspected bugs.
• Determining the remediation time and
• providing an update on UI.
• Scaling up to accommodate newer asks from users related to integration & security.
Solution
With our design thinking approach,
we followed a 3-step plan
Understand
Research, Synthesis
Design
Wireframes, Prototype
Evolve
Usability Tests
Step 1
Understand
Understand the product through brainstorming sessions with stakeholders. Clarify assumptions and queries, check for existing research, if any to uncover major pain points.
Research
Over the first week, I spent time analyzing the current version of the app, understanding a typical user journey from start to end and doing market research on competitors.
Quantitative & Qualitative Methods
I teamed up with the Product Manager to conduct quantitative and qualitative research for the app. User insights from surveys and contextual user interviews broke many assumptions and surprised us in positive ways.
![]() “The UI is not intuitive, and we spend a lot of time interpreting and reacting to the results of patching. Example: VVMS can say that patching is successful when in fact for kernel patching it didn’t actually install the new kernel.”
“The UI is not intuitive, and we spend a lot of time interpreting and reacting to the results of patching. Example: VVMS can say that patching is successful when in fact for kernel patching it didn’t actually install the new kernel.”
– Quote from an Employee
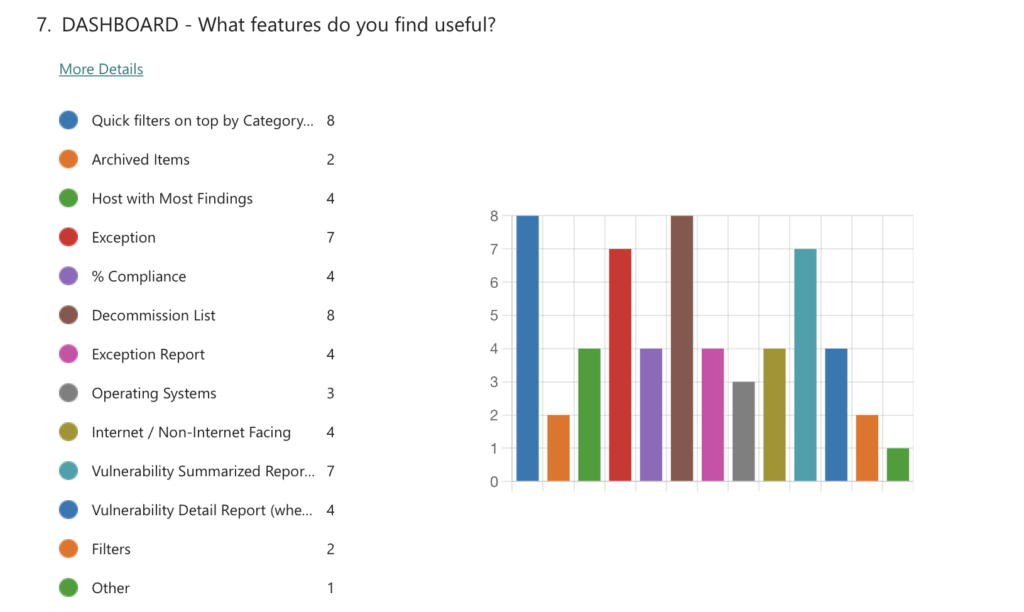
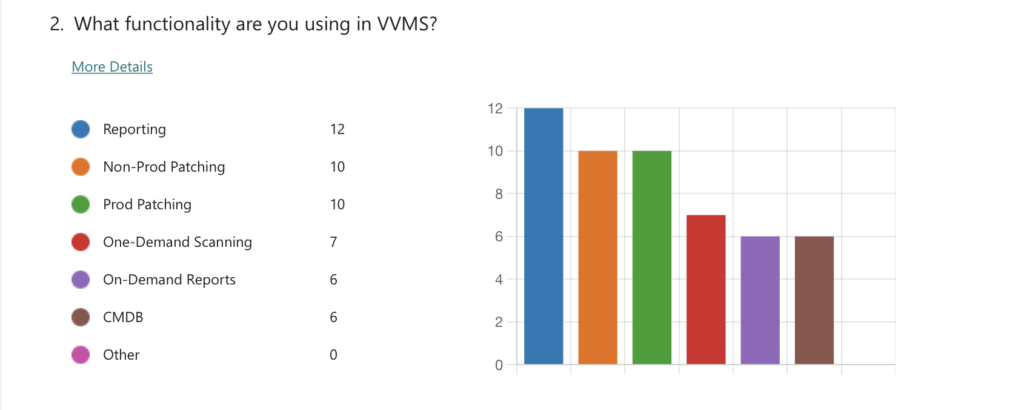

Data sampled from 20 users
Synthesis
We created an affinity map with categories of findings from the research. It helped us to prioritize user pain points and convert them into actionable items.
Kudos
Features that positively impact the usability and are especially liked by useful, or helpful to users.
These items should be kept.
Low
Problems that are cosmetic only and do not imapact the usability.
Fixing these items should be low priority.
Moderate
Problems that negativelty impact the usability, but do not stop users from completing the task.
Fixing these items should be medium priority.
High
Problems that cause significant difficulty, but do not necessarily stop users from completing the task.
Fixing these items should be high priority.
Critical
Problems that stop users from completing the task and/or using the platform.
Fixing these items should be critical priority.
| Recommendation | Priority |
|---|---|
| Add filters for environment, RRD, QID, Ageing, Scan status, operating system, New findings | Critical |
| Show data by servers in vulnerability report along with ATCs | Critical |
| Allow users to create custom reports and organize them | High |
| Refresh data at the top is useful | Kudos |
| Findings in the dashboard at the top are useful | Kudos |
| Allow users to create and save custom search templates in vulnerabilities page | Critical |
| Exclude maintenance windows while selecting time period in patch sceduling | High |
Goals
Based on the research synthesis, we came up with the main goals of the project.
Filter Mechanism
Users needed a clear filtering ability to refine vulnerabilities and keep track of priority remediations.
Listing Vulnerabilities
Product analysts (a persona type) needed list of findings and vulnerabilities together to better analyse the urgency and provide appropriate solutions to respective teams.
Automation
We came up with a solution to automate data from the backend that would save time spent in creating custom excel sheets.
Step 2
Design
Visualize the application in a way that addresses user pain points and can be scaled keeping up with the user experience.
Prototype & Features
Filters
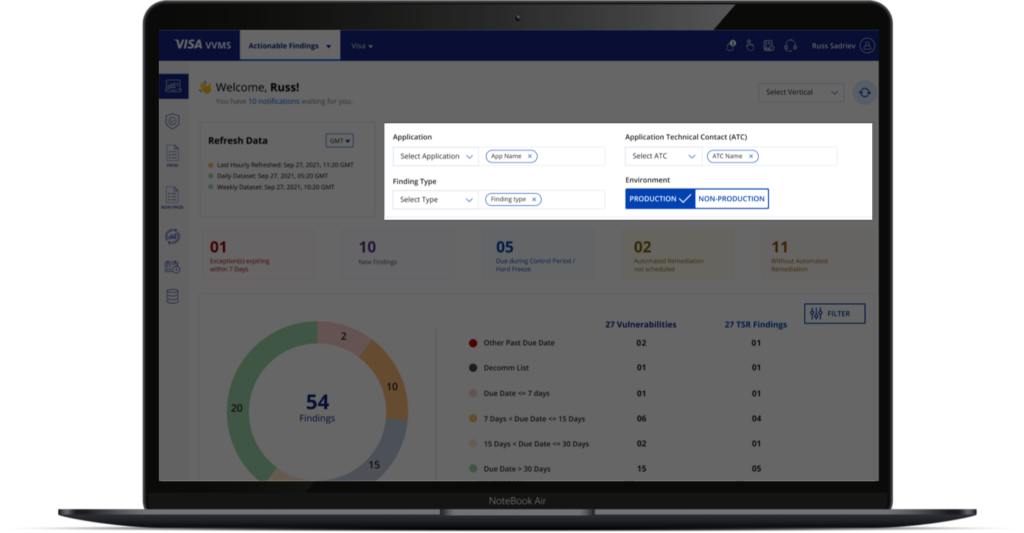
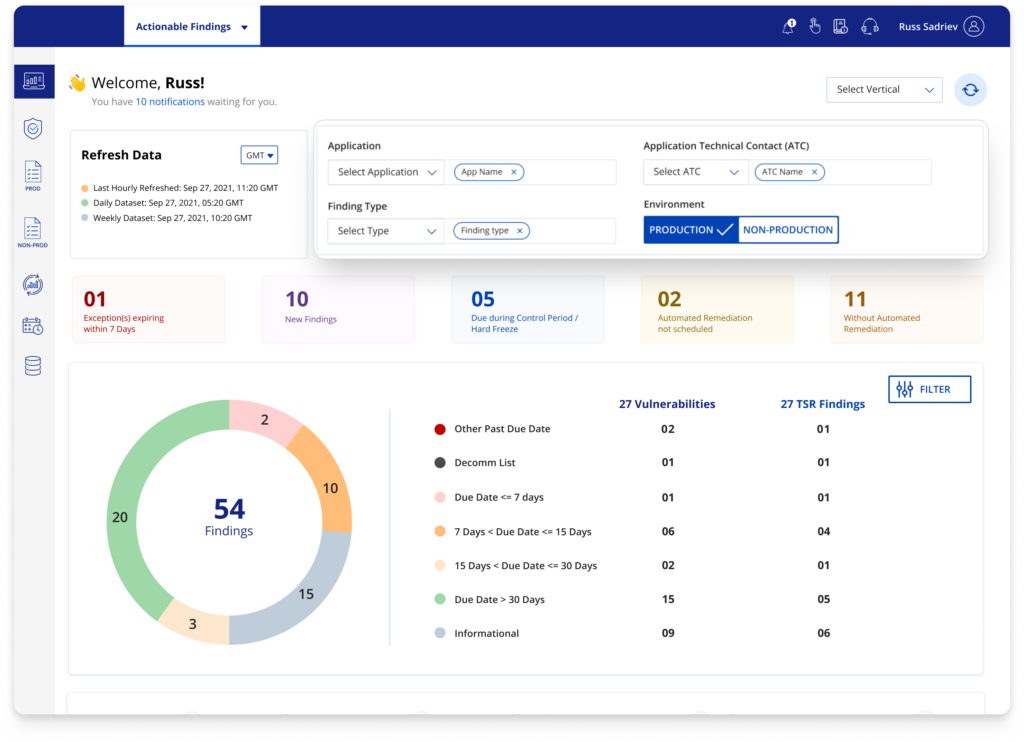
The research findings helped us understand that users rely on excel sheets to filter the data which adds up to their issues. We formulated a way to let users refine the results in the dashboard itself using Filters. The parameters shown in filters are based on the data collected during research.
22%
Increase in daily remediations in less than 3 months.
List of Vulnerabilities
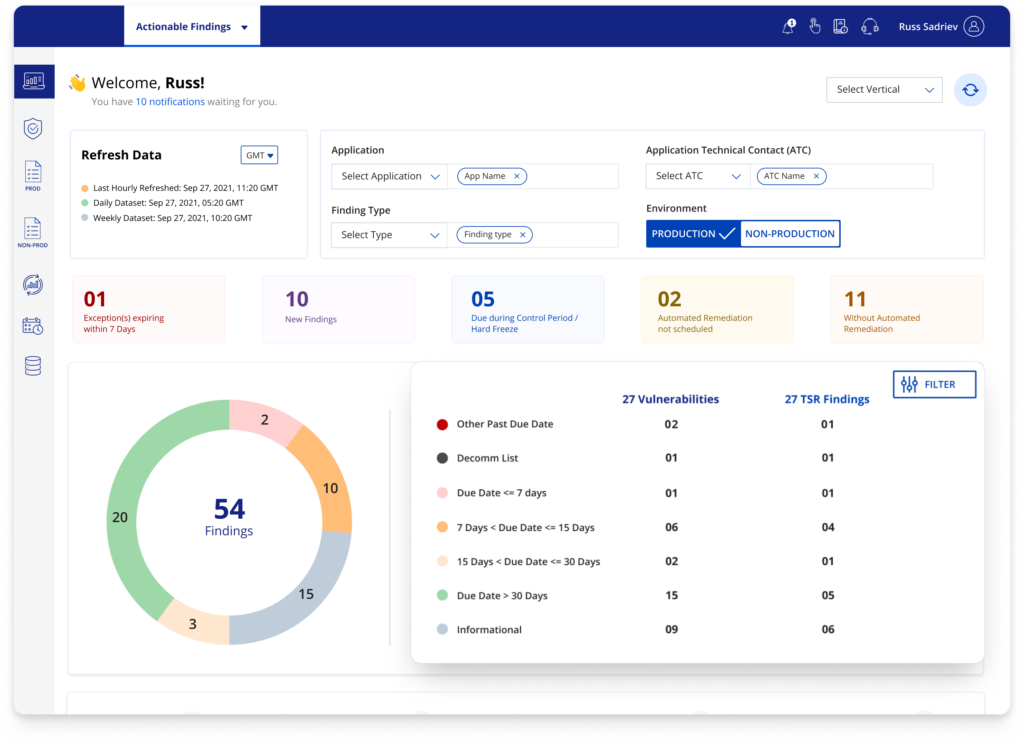
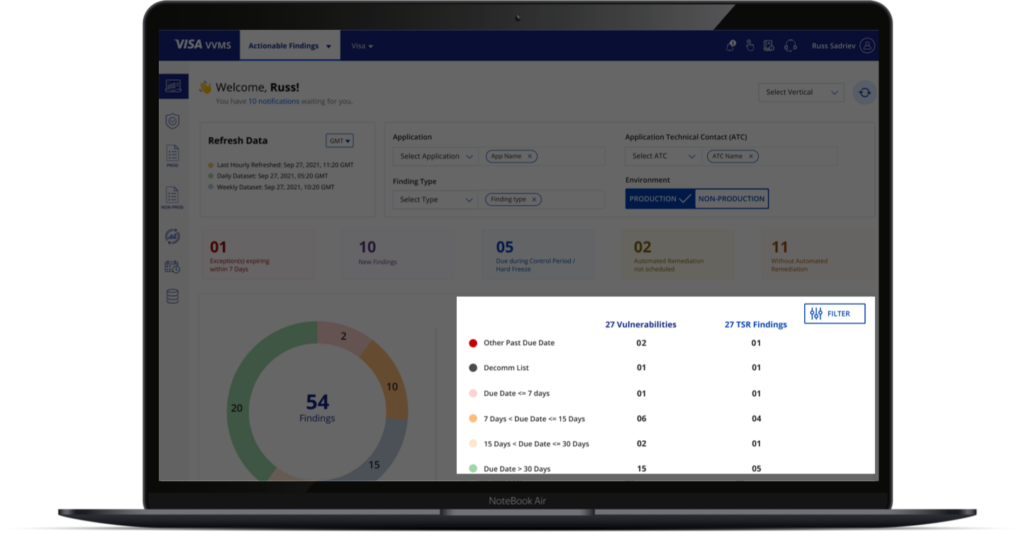
Another important feature is the list of vulnerabilities that we introduced as a part of our pilot which turned out to be successful. This list helped users track their vulnerability updates in one click.
14.5%
decrease in daily support tickets.
Automation
We worked with the development team to formulate data with the help of algorithms and scripts. The team is working on analysing the automation impact and it will be available in the next few months.
Step 3
Evolve
Continuous learning through user testing to improve the product consistently.
Usability Tests
Conducting scenario-based usability tests (manual) with selected users helped us validate our design solutions & stay assured on the approach for further enhancements.
![]() “I like the dashboard with the “funnel” on the right side, really help focus in on findings. I also like the ability to use vulnerabilities to filter to exactly which findings I am searching for across all apps.”
“I like the dashboard with the “funnel” on the right side, really help focus in on findings. I also like the ability to use vulnerabilities to filter to exactly which findings I am searching for across all apps.”
– Quote from an Employee after Usability test

